- 20Years experience
- +200Successful projects
- 13Countries we currently operate in
The future of Mineral Exploration
With proven track record of 41 clients discoveries around the globe. Welcome to Windfall Geotek (CN:WIN, OTCQB:WINKF and FRA:L7C2)

| What if you knew exactly what was in the ground and where? Windfall Geotek delivers technology to unearth the truth. Every time. Save time & money. Guess less & achieve more. |

Our Potential is Innovative, Disruptive, & Built on Proven Success
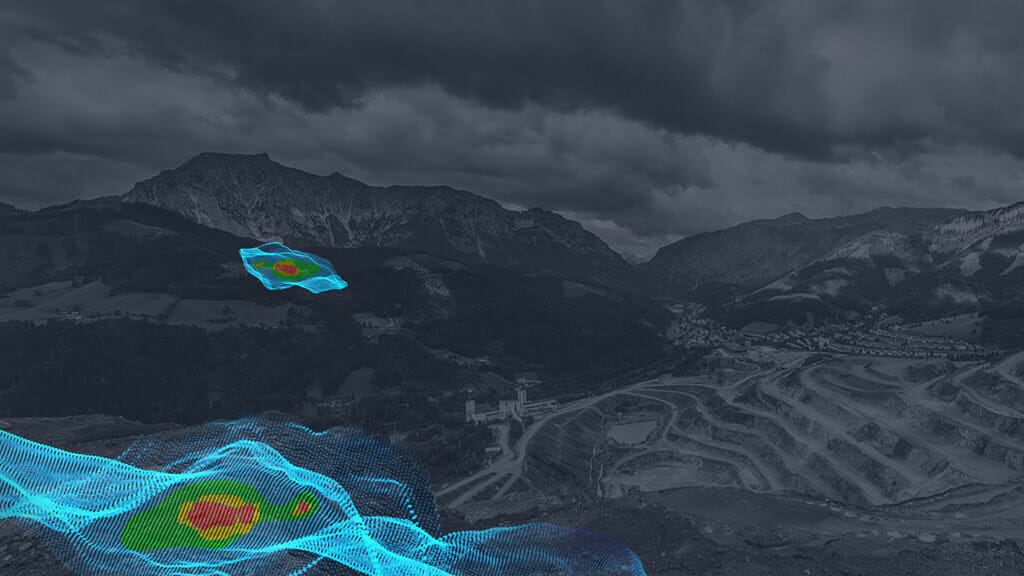
Windfall Geotek (formerly Albert Mining) is a Canadian corporation offering a proven and industry-leading digital platform leveraging Artificial Intelligence (AI) technologies to significantly improve outcomes in the exploration, development, operations and financing of geologically focused projects. Principal markets encompass the global resource mining industry including virtually all forms of mineralization including oil and gas exploration. Recent advances have led to the detection of water sources and aquifers especially in drought regions, and of anti-personnel landmines and related deadly legacy hazards in conflict zones. Our applied machine learning technology offers a revolutionary approach to geologic discovery and a markedly positive economic impact on operational efficiencies.
Since 2004 our Company has added value to over 41 client discoveries and more than 80 target generation projects around the globe.
Windfall’s business model of software licensing and select equity participation ensures excellent return on investment and provides our shareholders commensurate participation on validated exploration projects. Windfall Geotek is listed on the Canadian Securities exchange under the symbol WIN.

